
Micron: Gross Margin Plateauing In A Weak Macro Backdrop Is A Sell (NASDAQ:MU)
antos777/iStock via Getty Images")
I have previously written five articles about Micron Technology, Inc. (NASDAQ:MU). One thesis of those articles is that DRAM and NAND, the primary products of MU, are commodity-like. As such, the pricing of these products, and hence the profitability of MU, is governed by the industry supply demand balance. Another thesis of those articles is that MU’s gross margin (“GM”) is an excellent indicator of the supply demand balance in the market. This article will briefly revisit and update these two theses and point out that MU’s GM has been plateauing. This is not surprising given the backdrop of a weakening macro. I expect MU’s GM and profitability to roll over and decline in the coming quarters. As such, MU is a sell.
Memory products are commodity-like
Micron is a manufacture of memory products. DRAM products are the primary driver of MU’s revenue, representing 73% of total revenue in its F2Q2022, ended March 3rd. NAND products represented 25% of total revenue. MU serves the following OEM markets and the same OEM customers as all the other memory suppliers: data center, client devices (both enterprise and consumer), mobile, auto and industrial. MU has approximately 1.12 billion shares outstanding, trading at around $70 per shares, yielding a market cap of approximately $78 billion. MU has net cash of $4.2 billion, resulting in an EV of approximately $74 billion.
DRAM and NAND products are commodity-like, even though they are manufactured using a high-tech process in multi-billion-dollar fabs. Being commodity-like, memory pricing is dependent on the supply demand balance in the market. I will list the characteristics of a commodity and describe how memory products matches up with these characteristics: product uniformity, fungibility, price transparency, global market, and a large number of sellers and buyers. For more details, I will refer the readers to my first MU article for more details.
- Product uniformity: Memory products conform to JEDEC standards for items such as pin out, voltage requirements, packages and other characteristics. Conforming to standards assures that products are compatible across all manufacturers.
- Fungibility: all memory products of the same type are fungible. This means that a product from Manufacturer A can easily be substituted by a same product from Manufacturer B. In fact, all major OEMs require their designers to design their products so that they can switch from one memory supplier to another with no impact to their own product.
- Price transparency: Prices of memories are widely quoted by different services. Most memory products are sold under contract where prices are benchmarked to some indices and prices are frequently negotiated when the indices rise and fall.
- Global market: Memory products are trader globally. In fact, at one point, there was an exchange for the trade of DRAM products.
- A large number of buyers and sellers: There are three major suppliers of DRAM products, and five major suppliers of NAND products. Memory products are designed for used by all electronics OEMs. They are not customized for any particular customer.
I should also point out that I believe that commodities and producers of commodities will do well in today’s environment, especially those commodities that have a structural tightness in supply demand balance. I have written several articles about commodities: in crude oil where I favor APA (APA), in fertilizer where I favor CVR Partners (UAN), and in copper where I favor Freeport-McMoRan (FCX). However, memories do not exhibit the kind of structural advantage that crude oil, fertilizer and copper currently exhibit.
Gross margin is an excellent metric to measure supply demand balance
Supply demand balance is such an important issue driving the fortune of MU that management focuses on it during MU’s conference call. For example, during MU’s F2Q2022 CC, Mr. Mehrotra, MU’s CEO, said as part of his prepared remark on the market outlook: “Currently, we see a healthy supply-demand balance across both DRAM and NAND.”
As I have pointed out in my first MU article cited above, MU’s GM is the best metric to gauge the supply demand balance in the marketplace. I will further point out here that GM is an even better metric than ASP as a gauge for supply demand balance. The reason is that like-for-like ASP is declining most of the time as MU passes the benefit of cost reduction to its customers. Furthermore, ASP is affected by product mix. Hence, it may be difficult to sort out the relative magnitude of impact to ASP due to supply demand balance.
On the other hand, GM is an excellent metrics to gauge supply demand balance. When the market is tight, MU is able to better hold its line on price reduction, thereby increasing its GM. It may even be able to increase its price in very tight market situation. When demand slackens, MU has to reduce its prices more aggressively to move its products, thereby reducing its GM.
The importance of GM as a gauge to the supply demand balance and hence MU’s profitability is not lost to the analysts on the F2Q2022 CC. The first three questions from the analysts focused on GM and supply demand balance.
- From Mr. C. J. Muse: “how we should think about kind of the gross margin trajectory from here?”
- From Mr. Vivek Arya: “And what are you doing to make sure that you don’t oversupply to the data center?”
- From Mr. John Pitzer: “how much more upside do you think there is in the NAND gross margin business over time as you optimize the portfolio?”
Micron’s gross margin has plateaued, indicating that gross margin may decline soon
Since the cyclical bottom in F1Q2020 at 26.6%, MU’s GM has been steadily rising. However, MU’s GM has plateaued in the last two quarters at around 47%. Management is guiding GM to be around 47% for the current quarter, F3Q2022. This is shown in Figure 1.
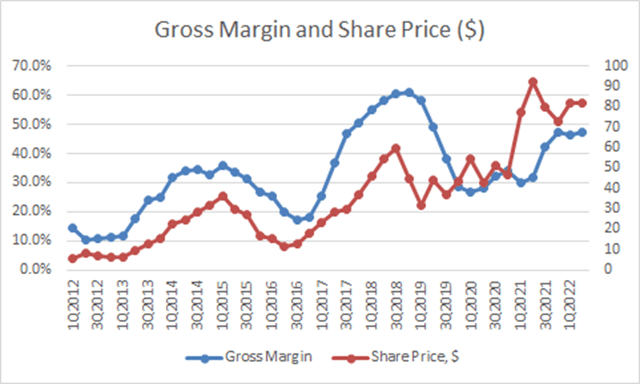
Figure 1: MU’s GM and share price. (MU’s press releases and SA data base.)
Figure 1 shows that historically, when MU’s gross margin started to roll over, it typically first plateaued for several quarters. We can see that in the peaks in late 2014 and late 2018. Hence, with the GM now plateauing, it is likely that MU’s GM will start to roll over within two to three quarters. I will provide more support for this argument below.
Figure 1 also shows that MU’s share price peaked as the GM plateaued in the last two cycles. The current cycle is a bit atypical as investors anticipated the bottom and the peak of the cycle. It may be likely that MU’s share price had already peaked in calendar 1Q2022 for this cycle due to investors’ anticipation of the rolling over of MU’s GM. Nonetheless, should MU’s GM actually roll over and decline, further share price weakness will ensue.
Macro backdrop is onerous for memory demand
To an investor, the important question is: What will cause MU’s GM to decline if supply demand balance is “healthy” as Mr. Mehrotra has reported? I believe that supply demand balance will weaken due to a looming demand reduction as the macro environment weakens. I believe we are seeing many events causing macro weakness playing out already.
Consumer demands are already slowing. The client device (mostly personal computers and tablets) demand driven by the pandemic is winding down. MU reported weakness in demand in this area in its F2Q2022 CC and so did Intel (INTC) in its 1Q2022 CC. Smartphone sales are slowing, particularly in China, where its consumers have been buffeted by wealth destruction due to the decline in the stock market, the weakness in the housing market driven by the insolvency of some of its largest property developers, and the COVID lockdowns.
The war in Ukraine and the ongoing drama of energy security issues for the European countries are causing the European economy to slacken. Some analysts are saying that Europe is already in a recession.
Worldwide, inflation is running at a rate that we have not seen for forty years, driven by the rapid increase in the price of energy, food, transportation, health care, and housing. Hence, there is less consumer disposable income after paying for these basic necessities. This will result in less demand for electronics where MU’s products are used. Meanwhile, the Federal reserve has started to increase interest rate to combat inflation. The yield curve has flattened and even inverted, showing investors’ uneasiness for a coming stagflation or an outright recession. As a result, households will trim their sails in spending, resulting in reduction in demand. Should a recession hit, not only will demand for MU’s product slackens, we will see a compression the MU’s valuation multiple, thereby depressing share price.
Management is reporting that currently there are three areas of strength in demand, in data center, enterprise client devices, and auto/industrial. When consumers cut back, enterprise profitability will be impacted. Enterprises will cut their IT spending. This will result in reduced demand in both the data center and the enterprise client devices areas. Similarly, when consumers cut back, auto will be impacted.
We may already be seeing the impact on MU’s GM in the current quarter. Management guided to a 12% increase in revenue but yet a flat GM QoQ for a seasonally strong quarter. This is telling me that MU has to reduce prices to hold its market share, which is not a good sign.
Higher-than-average capex in the last three years will exacerbate GM decline when demand rolls over
The big three DRAM suppliers, Samsung, Hynix and MU, have been investing in capex above the historical average for the past 3 years. This is shown in Figure 2. In Figure 2, the average capex spend was around 23.7% of revenue since 2010. As a quick reminder, in the memory business, supply is increased by an increase in capex. When demand continues to grow, the additional supply due to the increased capex will be absorbed. However, when demand slackens, as I expect that it will due to the macro backdrop, the additional supply will exacerbate the drop in GM and profitability. This is not unusual in this type of commodity-like business and I think this coming down cycle will not be different than the previous ones.
Worldwide DRAM revenue, capex and capex as percent of revenue. (Data compiled from IC Insights, Statista and Korea Times)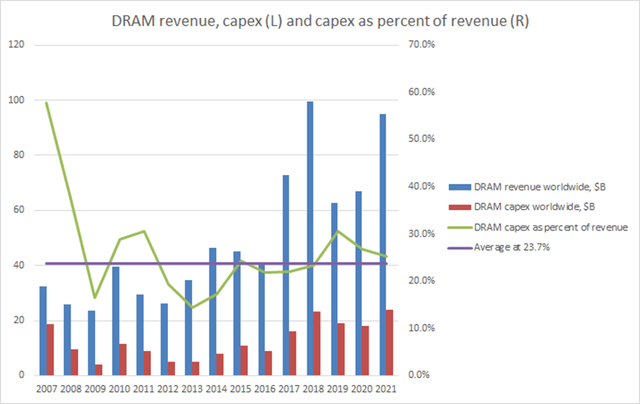
Takeaway
MU is in a commodity-like business where GM and profitability are driven by industry supply demand balance. MU’s GM is an excellent metric to gauge the industry’s supply demand balance. MU’s GM is plateauing. Historically, MU’s share price peaked when its GM plateaued. With a weakening macro backdrop, it is likely that demand for memories will decline. This weakening demand coupled with a higher-than-average capex for the last three years will cause supply demand balance to worsen. GM and profitability will likely decline. MU’s down cycle will then start to play out, causing its share price to decline, in my view.


